Milestone for Tyche Shepherd

Grid Survey Milestone – You may know that Tyche Shepherd maintains a survey of regions in Second Life. You can find the latest information at GridSurvey.com.

Elina at Burg Adenau 07102018_069

Elina at Burg Adenau 07102018_069

But, the milestone is the update published at SLUniverse, New SL Sims in past week. Daniel Voyager noticed the 100th post in a thread started in 2008.

If you have ever wondered which regions are in a particular RC channel, Tyche provides the best information available. It isn’t a perfect list of RC channels as things change quickly. But, it is the best available.

Daniel Voyager noticed the milestone…

Second Life – Please tell us…

Mesh Body Addicts is running their first survey of 2017. Please stop by and answer the questions. There are only 13… Luckily it isn’t Halloween. No fear.

See: Mesh Body & Head Survey 2017

I’ll have more to say about this video in a following article.

Daria lists 26 bodies in the survey when asking which you wear most often. 26! Plus, “other”… Amazing. In only a few months we have a load of competing brands and models. Continue reading

Second Life: What Viewer Statistics?

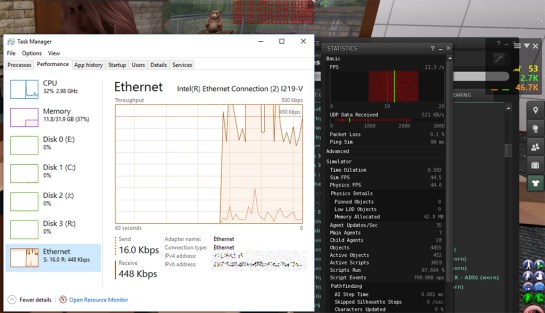
If you have ever pressed Ctrl-Shift-1 to reveal the Viewer Statistics panel and wondered what all the stuff means, there is a good explanation of the items in the panel over at the Firestorm Viewer Wiki. See: Firestorm Viewer Statistics. Almost the same information is available in the SL Wiki: Viewer help: Statistics.

Network Transfer Rate Comparison

I think on both sites they have simplified the text for the less techy users. I think that is a bad idea, as the people looking for explanations of how the items in the panel work are likely tech savvy.

The first four items listed on the pages are the source of a lot of confusion; FPS, Bandwidth, Lost Packets, and Ping. So, I’ll provide a bit more information. Continue reading

How Virtual Worlds Will Take Over Real Life

From a speech by by Philip Rosedale, former Linden Lab CEO – 28 minutes. Philip uses Second Life to show what is happening in virtual worlds and how it will affect society. His thinking is interesting and in some ways a bit scary.

The video is the basis of an NPR show TED Radio: Why Build a Virtual World? Follow the link to see the video. I can’t embed it, only the audio portion, which is 9 minutes. The video and audio have different content. Both are interesting.

NPR/KPBS presented a radio show titled Screen Time. Philip Rosedale was a guest for the show. The audio above is also here: KPBS: Screen Time. The video is where some of the sound track for the show came from. The video is more interesting than the audio. The radio show has more context and less content, the audio is only 9 minutes long. It is worth checking both.   Continue reading

Is Second Life Sex More Fun than RL Sex?

Someone got the idea to run a poll of which sex is more fun, RL or SL/Virtual sex. RL won, no surprise there. But, 36% thought Second Life™ sex was more fun… hummm.

On a side note: It is the owner of Basilique, the place where the Lindens are doing their meet up today, that conducted the study: Canary Beck.

Maria Korolov posted a link to a recent study of sex in SL in her: Survey: virtual sex less fun, but more liberated.

The full study she refers to is here:  Second Life sex versus real life sex. It is long and well worth reading. I touch on JUST the parts I found really interesting.

Goddess Xita

Goddess Xita by Alice DiXita, on Flickr

No surprise, they found in a 2012 study and this recent study that sexual practices in Real Life and Second Life differ. So, you are not the only one that is more kinky in SL than RL.  Continue reading

Second Life 2014 in Review

Writing the annual review is a lot of work and takes time I will be using for RL projects. Ciaran and others have written their reviews of 2014. I’m going to skip mine this year. But, I do have some thoughts on 2014 and the coming 2015.

I have been tracking concurrent user numbers for the past 3 years.

Concurrent Users 2011 to 2014

Concurrent Users 2011 to 2014

There has often been a discussion about whether or not there is a seasonal aspect to the use of Second Life. I think the chart answers that question. It shows most clearly in the peak concurrent users line and a bit less in the minimum line, but it is still there.

Notice that about July-August of each year there is a low point in the numbers. From then to February-March the numbers increase to a peak then start to fall to the February-March low point. It seems pretty consistent from year to year for the last 3 years.  Continue reading

Some OpenSim Stats

It is a slow news day… So, I took some time to run down some stats. You might remember that back in January 2012 Hypergrid Business ran a rebuttal to and article by Hamel Au’s on New World Notes: Is OpenSim usage falling? vs OpenSim Gaining Regions… But Not Gaining Many Users.

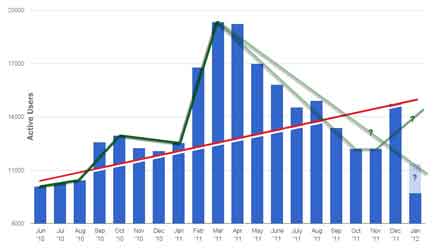
Possible Trends – Jan 2012

The graph supplied by Maria Korolov on Hypergrid could be looked at numerous ways. In Hamlet’s eyes OpenSim was losing users. In Maria’s they were gaining users. My take was that for most of the last year OpenSim had been losing users. So, the red line is Maria’s and the green lines are mine.

It is now 9 months later. Has the trend changed? Is OpenSim gaining or losing users?

Continue reading

Some Stats on Second Life Users

Browsers in Use

Since this blog is primarily about Second Life™ I think it fair to say my visitor stats are representative of SL Users. If you are interested in knowing what hardware and screen resolution other SL residents are using, read on.

The stats are from my Google Analytics account. If you use both Google’s and WordPress’s stats you’ll notice considerable difference in how they count visitors and page views. Google is much more conservative. In general Google reports visitors and WordPress page views. Since my readers read 1.76 pages per visit my Google stats are about half what WordPress shows.

Google provides stats that are not available from WordPress. For instance, how many people visit your blog every day? In my case: 80+%. Every second day? Third? Longer? Once a month? In my case: 2.2%.

Continue reading