Second Life 2014 in Review

Writing the annual review is a lot of work and takes time I will be using for RL projects. Ciaran and others have written their reviews of 2014. I’m going to skip mine this year. But, I do have some thoughts on 2014 and the coming 2015.

I have been tracking concurrent user numbers for the past 3 years.

Concurrent Users 2011 to 2014

There has often been a discussion about whether or not there is a seasonal aspect to the use of Second Life. I think the chart answers that question. It shows most clearly in the peak concurrent users line and a bit less in the minimum line, but it is still there.

Notice that about July-August of each year there is a low point in the numbers. From then to February-March the numbers increase to a peak then start to fall to the February-March low point. It seems pretty consistent from year to year for the last 3 years. 
Read more

Some OpenSim Stats

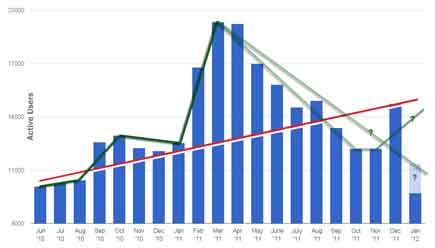
It is a slow news day… So, I took some time to run down some stats. You might remember that back in January 2012 Hypergrid Business ran a rebuttal to and article by Hamel Au’s on New World Notes: Is OpenSim usage falling? vs OpenSim Gaining Regions… But Not Gaining Many Users.

Possible Trends – Jan 2012

The graph supplied by Maria Korolov on Hypergrid could be looked at numerous ways. In Hamlet’s eyes OpenSim was losing users. In Maria’s they were gaining users. My take was that for most of the last year OpenSim had been losing users. So, the red line is Maria’s and the green lines are mine.

It is now 9 months later. Has the trend changed? Is OpenSim gaining or losing users?

Read more

Some Stats on Second Life Users

Browsers in Use

Since this blog is primarily about Second Life™ I think it fair to say my visitor stats are representative of SL Users. If you are interested in knowing what hardware and screen resolution other SL residents are using, read on.

The stats are from my Google Analytics account. If you use both Google’s and WordPress’s stats you’ll notice considerable difference in how they count visitors and page views. Google is much more conservative. In general Google reports visitors and WordPress page views. Since my readers read 1.76 pages per visit my Google stats are about half what WordPress shows.

Google provides stats that are not available from WordPress. For instance, how many people visit your blog every day? In my case: 80+%. Every second day? Third? Longer? Once a month? In my case: 2.2%.

Read more

Second Life Statistics Week 12

Every so often I see someone using statistics to back up a viewpoint they have. It is very common among Warmistas and Deniers. We also see politicians misusing statistics. The most common misuse of stats is to select the data segment and use it to PREDICT the future. If that worked, everyone would get rich playing the stock market.

So, recent articles on stats got me wondering what was up. I used to write an article each month on SL statistics. Unless stats are showing change, they get pretty boring. It’s been 16 weeks since I wrote about Second Life Statistics (Sept. 2011).

Sign Ups

Rod Humble, the Linden Lab CEO, seems to have been spinning a bit when he said, “…and over the holiday period we had over 20,000 new people sign up a day.” Well, take a look at the stats. I get the images from Tateru’s site, Dwell On It. I composite them in Photoshop to provide a longer period. You can click the image below to see a larger version.

Daily Signups

It looks like for the month of December the average could be over 20,000 per day. So, the spin, like all good spin, has truth in it. But, since then the sign ups have been in a steady decline.

Read more

#SL Mesh Statistics

At the last Content/Mesh User Group Charlar Linden provided some interesting statistics on mesh in Second Life.

55%

55% of users logging in are running mesh capable viewers. This number is probably mostly the pre-Phoenix mesh release stat. Talking with Jessica, of the Firestorm-Phoenix team, she believes the change to the newest Phoenix viewer will up that percentage to 80%

Mesh Sales

In the past week the sale of mesh objects has doubled (Gross Revenue).

Regions

18% of the regions in Second Life now have mesh objects rezzed in them.

Read more

Second Life Statistics Week 37

There are really no changes in the statistics this month. Trends are continuing. So, I’m not posting graphs or doing detailed analysis. I do have some comments.

I can see a slight consistent increase over the last 5 months in daily sign ups. It looks like that is trending upward and is pretty well established. So, I think the changes in the SL sign up process have made a significant difference. We can say that change is working.

On the other hand, concurrent logins are trending down or up depending on the data you consider. Metaverse Business stats were the best for seeing the detail of what was happening, having the max and min login with the average. But, their stats stopped when the SL Splash page changed. They have yet to fix the problem. If you are interested, send them an email.

Read more