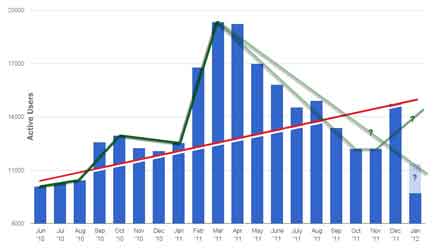
It is a slow news day… So, I took some time to run down some stats. You might remember that back in January 2012 Hypergrid Business ran a rebuttal to and article by Hamel Au’s on New World Notes: Is OpenSim usage falling? vs OpenSim Gaining Regions… But Not Gaining Many Users.
The graph supplied by Maria Korolov on Hypergrid could be looked at numerous ways. In Hamlet’s eyes OpenSim was losing users. In Maria’s they were gaining users. My take was that for most of the last year OpenSim had been losing users. So, the red line is Maria’s and the green lines are mine.
It is now 9 months later. Has the trend changed? Is OpenSim gaining or losing users?
I dug up some stats and took a look. These are pretty much raw numbers. I did not analyze them for aberrations or anomalies. The data is all over the place with 30 Day Actives ranging from 0 to 8,000+ depending on the grid, with a median of 14 and an average of 160±.
One of the interesting things is the number of companies that are operating grids. That number has been growing over the last 12 months. In fact the number of operators has doubled from 80+ to near 160. These grid operators are basically business competitors competing for users.
One has to consider if these new grids are finding new users or are they just taking dissatisfied user from other grids? As we look through the rest of the stats that answer appears to be the same number of users is being divided up among more grids.
An odd aspect of this growth is the number of regions across all the OpenSim grids has not changed much. We sort of have more grid operators providing the same number of regions. That suggests unhappy grid owners are moving from grid to grid, which is easier on OpenSim. One can backup a region in one grid and restore it in another grid, not all grids, but some.

12 Months – Little Growth
There is a phenomenon in OpenSim that we have to take into account. In the chart above there is a dip in region count from February to March. I doubt that all of a sudden, in one month, almost 5,000 regions evaporated. This dip in the chart is from how OpenSim servers work. Once a region is entered into the system, it stays registered whether it is there or not. Then one day the grid operator decides to run a garbage collection and clean things up that removes all the regions no longer attaching to the grid. If the operator happens to be OSGrid, one of the biggest grids, there is a huge number of regions that drop out of the count. It’s just an aberration in the data.
These aberrations make it really hard to know what is or is not happening in the OpenSim world.
Reporting is flaky in the OpenSim world. Grid operators look at the numbers that interest them. If they get around to it and want to, they make them available to others. Commercial grids have a vested interest in making their product look good. We’ve seen that behavior from Linden Lab too. So, reporting is at best inconsistent.
The total users for a grid usually only ever goes up. Once a person registers they are a user forever. So, we see the Second Life™ numbers climb year after year. In OpenSim they go up and down. That is probably because when a grid closes all those users disappear from the numbers.
Also, we have to consider that a user registered with Second Life will likely also be a user in an OpenSim grid. I think I’m signed up for 6 or so different grids. Plus there are Alts. I can’t even start to speculate on how many users are double, triple, or more counted in OpenSim grids.

12 Month – Total users
Over the last year the Total User in OpenSim has been increasing. I would expect that to continue. The same is true for Second Life.

